
Carsten Hagemann
Estimated reading time: 6 minutes
Benchmarking Android, Java & Kotlin builds with gradle-profiler
Gradle builds contain complex tasks, many of which can be cached. Manually running a build three times on the same machine and then averaging the run time perhaps works for simple cases. If you start comparing build times of different Gradle versions or branches though, you will want to use something more elaborated. In our…

Gradle builds contain complex tasks, many of which can be cached. Manually running a build three times on the same machine and then averaging the run time perhaps works for simple cases. If you start comparing build times of different Gradle versions or branches though, you will want to use something more elaborated.
In our case, we wanted to benchmark how the build time of our Android project is impacted by enabling Java 8 core library desugaring and filtering unneeded build variants to see whether there are performance impacts or not. These use cases are quite specific to our project, that’s why in this article I am going to describe generic benchmarking use cases which you can adapt as you see fit. The tool gradle-profiler is used to run the benchmarks.
Getting Started
Before starting, we need to install the gradle-profiler binary. You can do so on macOS running brew install gradle-profiler (if you have homebrew installed) or sdk install gradleprofiler (if you have SDKMAN! installed).
After that is done, we will create a folder called profiling inside the root folder of our codebase, so that the following profiling-related files and folders are contained in there.
Scenario file introduction
Next on, we are going to create a file called profiling.scenarios in the aforementioned folder. In this file we will write down the individual profiling scenarios and their corresponding configurations. After describing some scenarios, we will learn how to run them as well.
Incremental Resource Change Benchmark
In the profiling.scenarios file we have created, we are going to add a so-called scenario (sort of like a task group) in which an Android resource file gets modified, simulating updated translations. I will shortly explain key concepts, but you can also refer to the tool’s documentation for further reference.
incremental_resource_change {
    tasks = ["assembleBrandRedEnvIntegrationDebug"]
    warm-ups: 1
    iterations: 3

    apply-android-resource-change-to = ["app/src/main/res/values/strings.xml"]
}
incremental_resource_changeis the name of this specific scenario.tasksspecifies which Gradle tasks get run.warm-upsspecifies the number of times the scenario should run before actually counting the time. In this case one warm-up is necessary because we want to benchmark incremental changes.iterationsis the number of times the benchmark should run, in order to get a meaningful average run duration.apply-android-resource-change-toadds a string to the specified XML file. This will get removed aftergradle-profilerhas finished running.
Incremental Code Change Benchmark
Not only can resource files be changed via the profiler. We can also configure the tool to add methods to our Java/Kotlin or C/C++ files in order to force incremental code builds.
It’s not very common, but some projects do use native C/C++ code and the NDK for native libs, so here’s a way to also benchmark that type of code. Note that during the time of writing this article, there’s a small bug where not all valid C/C++ files can be modified.
incremental_code_change {
    tasks = ["assembleBrandRedEnvIntegrationDebug"]
    warm-ups: 1
    iterations: 3

    apply-abi-change-to = ["app/src/main/java/de/maibornwolff/sample/App.kt"]
    apply-cpp-change-to = ["app/src/cpp/library.cpp"]
}
apply-abi-change-tomodifies specified Java or Kotlin classes, whileapply-cpp-change-tomodifies C/C++ header and source files. These two statements add functions to the source files.
Full Builds: Benchmark JVM Arguments, Gradle Versions, Gradle Variables…
We can also benchmark how long full builds take. This is the most meaningful scenario as a full build is required for CI builds or when building after switching branches that differ a lot:
clean_build_2gb_ram {
    tasks = ["assembleBrandRedEnvIntegrationDebug"]
    warm-ups: 1
    iterations: 3

    cleanup-tasks = ["clean"]
    jvm-args = ["-Xmx2g", "-XX:MaxMetaspaceSize=512m"]
}

clean_build_4gb_ram {
    tasks = ["assembleBrandRedEnvIntegrationDebug"]
    warm-ups: 1
    iterations: 3

    cleanup-tasks = ["clean"]
    jvm-args = ["-Xmx4g", "-XX:MaxMetaspaceSize=512m"]
}
cleanup-tasksare the Gradle tasks that get ran before each warm-up and iteration run. As we want to benchmark full builds, we want to throw away configurations, transformations and other cached code.jvm-argsare arguments passed to the JVM which runs the Gradle tasks.
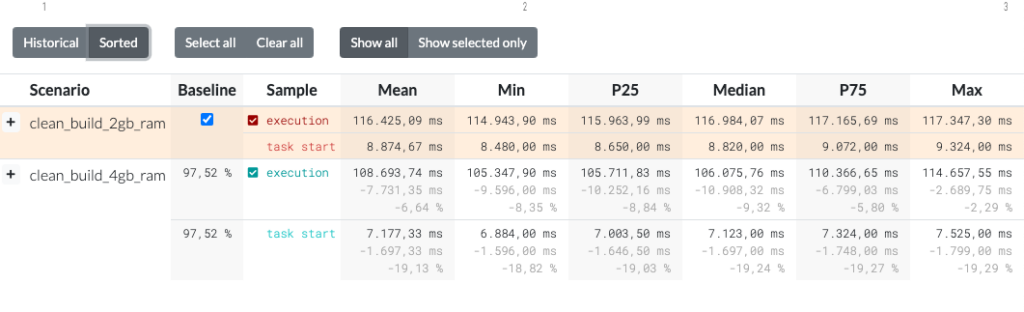
In this case, I’m comparing between the default amount of RAM allocated to gradle’s heap space to a custom amount (4 GB, note the “4g” at “-Xmx4g”). The results surprised me: As the screenshot below shows, 10 seconds get shaved off thanks to the larger RAM amount. In relative numbers that’s -9% (see the Median column) less. Very likely this time was saved during the garbage collection (GC) process.
You can try playing with this value in order to get faster build times. You can even try to do this for your CI agents. Since we are already on the subject, you can edit the allowed RAM usage like this:
- Via Android Studio’s UI: Open the Android Studio settings, click on Appearance & Behavior, System Settings and then Memory Settings.
- Via your favorite editor: Either edit the user-wide
~/.gradle/gradle.propertiesor your project’sgradle.propertiesfile, and either edit or addorg.gradle.jvmargs=-XX:MaxPermSize=512m -Xmx4g.
Further, it’s possible to benchmark variables in your build.gradle files, like for example the Android Gradle Plugin version, the Kotlin compiler version, etc. Also, you can measure the impact of different Gradle versions by specifying for example versions = ["6.6", "6.8"] in a scenario file. Benchmarking different JVM versions is currently not supported, but you can add a thumbs-up to that GitHub issue.
Running the Scenarios
You can view my profiling.scenarios file containing the previous examples to avoid having to copy-paste each scenario individually.
Now you know the basics about gradle-profiler scenarios, but you don’t know to run them yet. Don’t worry, here’s how:
- Go to the profiling folder of the project in your terminal, then run the following command. Make sure to add the scenario names you wish to compare against at the end of the command.
- Run
gradle-profiler --benchmark --project-dir .. --scenario-file profiling.scenarios scenarioName1 scenarioName2. If you have named the folder or the scenario file in a different way, you will need to adapt this command. - Get a cup of tea or coffee and wait some minutes.
- Open the output folder (named like
profile-out-2or so) and open the generated .html page. You can then compare the task runs of the different scenarios on that page.
Further Considerations
Instead of only performing one-off benchmarks, one could integrate regular comparisons to their CI Pipelines. For example, a nightly CI Job can be created that compares the build times of the latest development changes to those of some days ago. If a certain percentage threshold is exceeded, the job fails, and an email is sent out to the Dev Team.
About the author
Carsten Hagemann
Senior Software Engineer
Continue reading
Related posts
-
Techblog
The Dawn of a New Tech Era:
Apple’s Vision ProSmartphones are still the driving force of the tech industry. Nevertheless, the leaps in innovative development are getting smaller and smaller. So it's time to ask: What's next? For Patrick Gaißert, it's clear that the age of augmented reality glasses has arrived. In this article, he explains why and how the Apple Vision Pro is…
-
Techblog
End-to-end-testing with Cucumber and Gherkin
In their last project, our software engineers Pau Sánchez and Carlos Rodriguez worked on automated end-to-end tests for Flowers Software. In an innovative way.